Both in autonomous driving and in industry, disturbances from the environment, such as background light, are always a challenge for LiDAR systems. For the reliable use of optical sensors, it is crucial how disturbances from environmental factors can be reduced to improve the robustness of the system while maintaining real-time capability. In a research project, Fraunhofer IMS is developing a robust machine learning-based algorithm for distance determination called "multi-peak analysis (MPA)" for LiDAR histogram data under harsh detection conditions. Rough detection conditions in this context include environments with strong background light (high background photon rate), situations with objects at long distances, and a high required frame rate.
A variant of MPA is the neural network based MPA (NNMPA), which uses a very compact feed-forward neural network without compromising the precision of the detected distances. After a physically driven feature extraction, the neural network requires only 1% of the original data for training and prediction. For the evaluation of the NNMPA, 100,000 LiDAR histogram data (both synthetic and real) based on the flash LiDAR system "OWL" developed by Fraunhofer IMS are used.
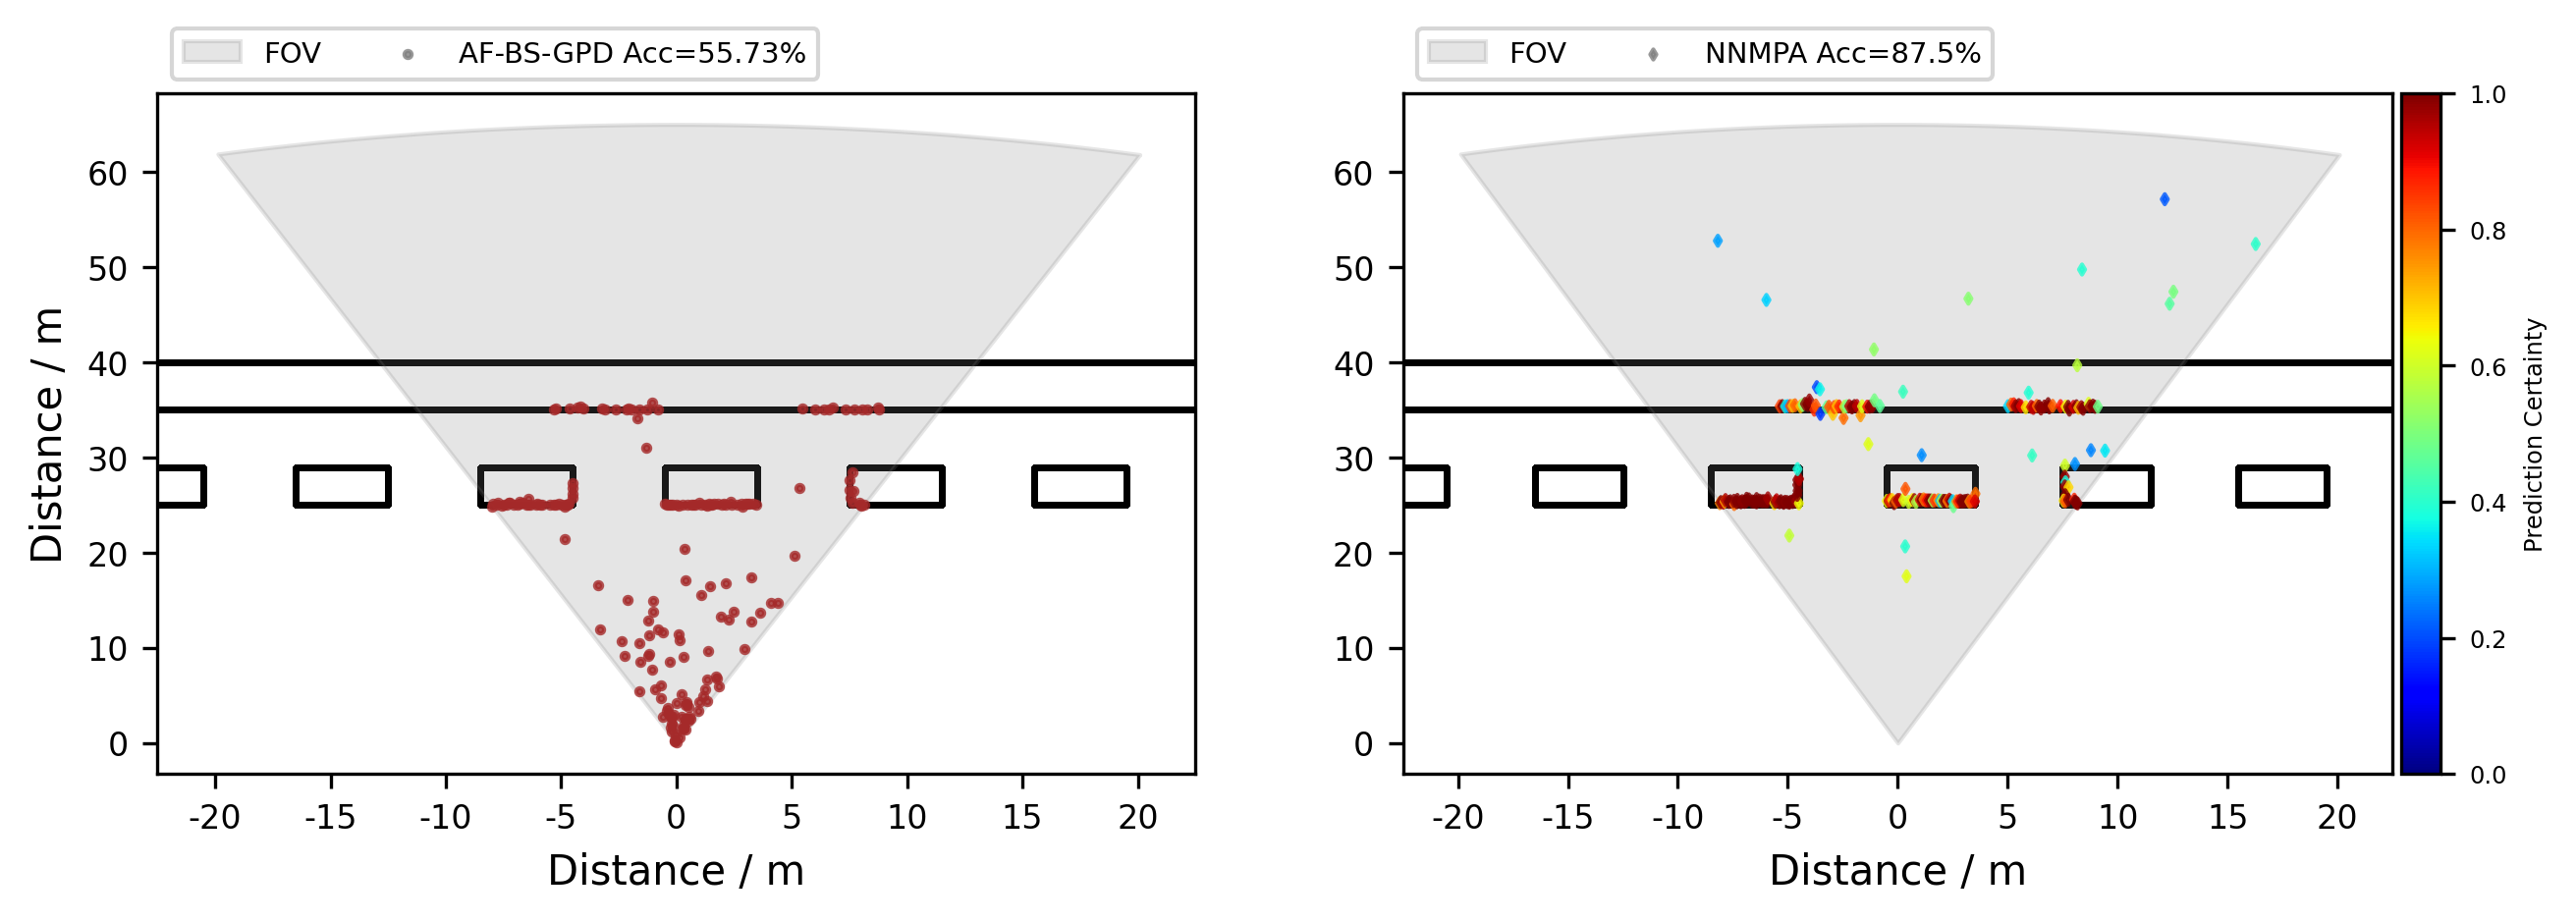
NNMPA was compared to classical digital processing, which includes a mean filter, background subtraction, and global peak detection (AF-BS-GPD), and shows superior results. For example, at target distances of 25 to 60 m and high background light levels, the distance determination accuracy of NNMPA is 26% higher than that of AF-BS-GPD. An example can be seen in Figure 1. In this particular scenario, the AF-BS-GPD is strongly perturbed by background light (left diagram). This results in almost half of the distance determinations being incorrect. The measured distances should be much smaller than they actually are (clustering of the "red dots" in the lower region). The NNMPA (right diagram), on the other hand, achieves an overall accuracy of almost 88%. Furthermore, the NNMPA additionally provides the information of the measurement quality, which is represented by the color in the right diagram. Furthermore, it can be seen from the right diagram that the false determination results have a relatively low measurement quality. This information is particularly useful for subsequent further processing and decision-making.

